
How Carillion’s dividend outlived its cash flow
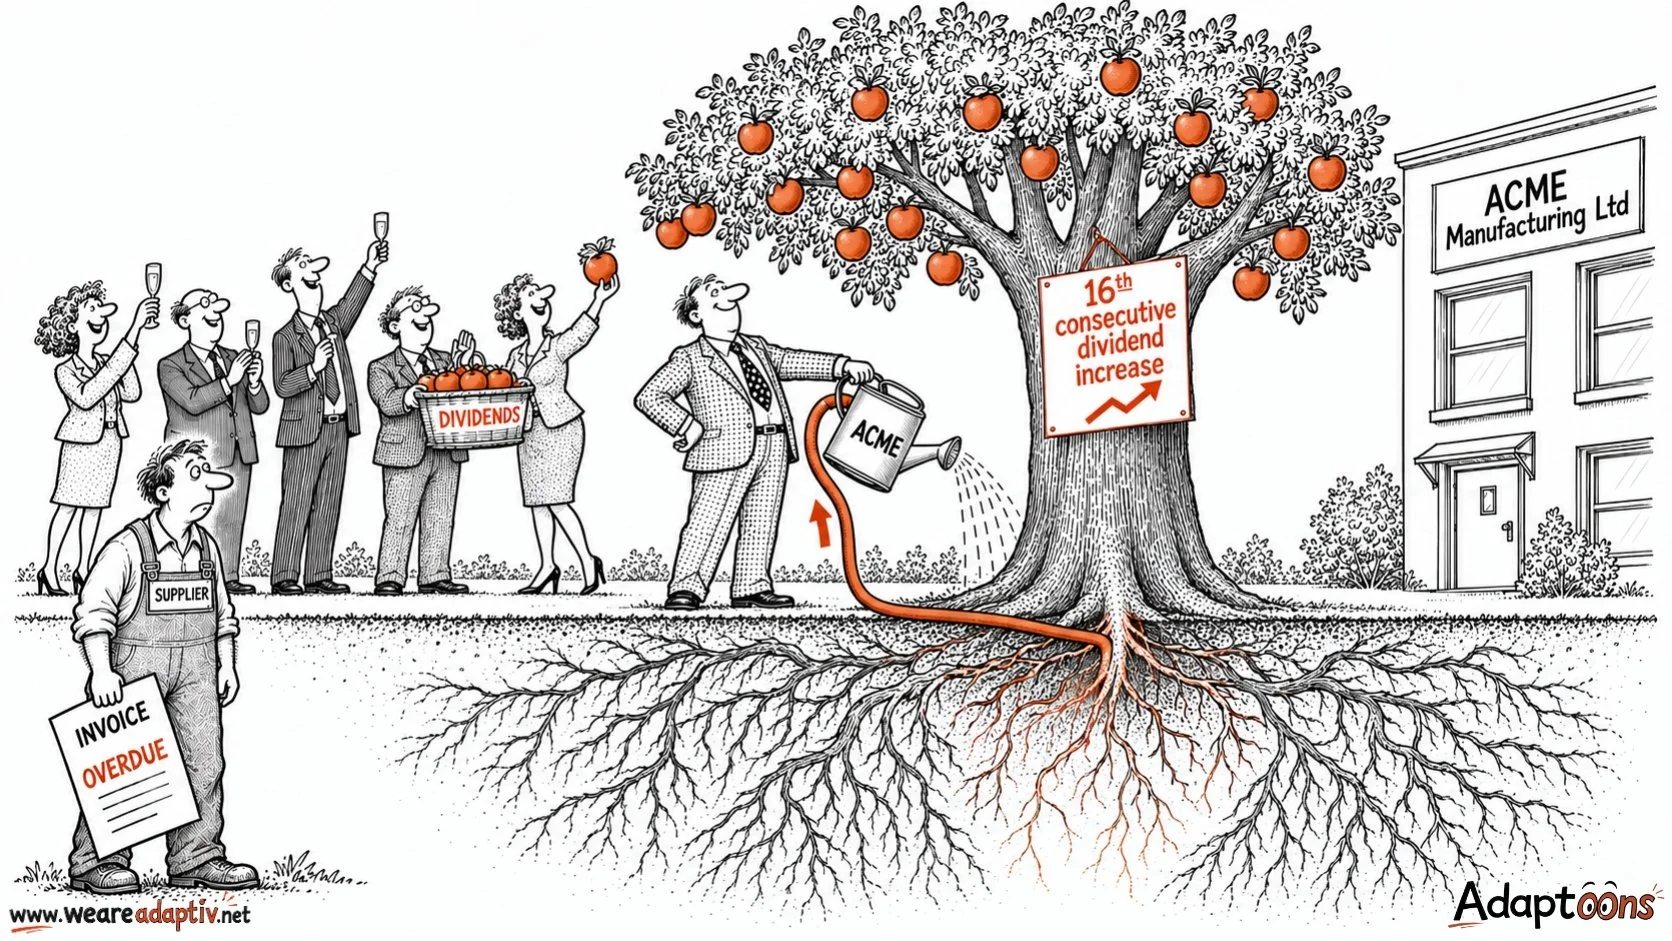
On 9 June 2017, Carillion paid £54.4 million to its shareholders.
Thirty-one days later it announced a provision of £845 million against the value of its contracts, suspended the dividend and lost around seventy per cent of its market value over the announcement and the two days that followed.
The dividend had been proposed on 1 March. It was Carillion’s sixteenth consecutive annual increase.
The rise itself was almost ceremonial: from 18.25p to 18.45p a share, two-tenths of a penny. The announcement carrying it was headed “Performance in line with expectations”. It pointed to a pipeline of contract opportunities worth £41.6 billion, put revenue visibility for 2017 at 74 per cent and said the group had a good platform from which to develop the business in the year ahead. KPMG’s audit opinion on the 2016 accounts was dated the same day.
The surrounding system agreed. KPMG issued an unqualified opinion that the accounts gave a true and fair view, and reported no material uncertainty about the company’s ability to continue as a going concern. Carillion sat in the FTSE 250 and was held through income funds and the trackers that follow them. It was one of Britain’s largest construction and services groups, running around 450 public sector contracts and employing 43,000 people worldwide. Government departments carried on awarding it work. The dividend record reached back further than the financial crisis and had survived it.
None of that looked absurd on 1 March 2017. The auditor and the index and the income funds and the government were all pointing the same way. That is the problem.
A long run of rising dividends is supposed to carry weight because it is expensive to fake and hard to sustain without real cash behind it. The record is valuable precisely because it cannot be manufactured. Which is also why, once it exists, contradicting it becomes so costly that almost nobody will.
The received account of what happened next is a run of bad contracts. A hospital in Liverpool, a road around Aberdeen, a hospital in Birmingham, a development at Battersea, and several hundred million pounds owed and unpaid in the Middle East. Concentrated bad luck, in a sector where lowest-price tendering leaves nobody much room. All of that is true, and none of it accounts for the shape of what followed. The condition that mattered had been going for years, in public, in the company’s own accounts.
Across the five years to 2016, Carillion paid out sixty-three million pounds more in dividends than its operations generated in cash.
That gap is worth your attention. It does not look like a problem. In a set of accounts it looks like confidence, and it looks the same in yours as it looked in theirs.
The mechanism that kept it looking that way has a name and a date.
In 2013 Carillion established an early payment facility with its banks, a structure also known as reverse factoring. Standard supplier terms had been extended to 120 days shortly after the government launched its supply chain finance scheme, an initiative Carillion helped shape and was among the first to join. Under the facility a supplier could sell its invoice to Carillion’s bank and be paid at 45 days, less a discount. Carillion settled with the bank when the 120 days were up. The supplier received its money earlier and received less of it. Carillion held on to its cash for another seventy-five.
The company’s final finance director later told MPs the arrangement was used deliberately, to protect Carillion’s own working capital.
A tree drawing on its own root system looks unchanged for a long time. So does a balance sheet.
The consequence sat in the accounts. What Carillion owed the banks under the arrangement was presented as other creditors, alongside ordinary trade payables, rather than as borrowing. Moody’s and Standard & Poor’s both argued afterwards that the facility was debt-like. Moody’s put the sum misclassified at as much as £498 million. Carillion’s own audit committee papers show the amount actually drawn was £472 million.
Two things followed from that, and both of them flattered. Presented as creditors rather than as debt, the facility sat outside the debt-to-earnings ratio that formed a key covenant test with the company’s lenders. Counted properly, that covenant would most likely have been breached long before it was.
The second was larger. Carillion had a stated target of converting all of its operating profit into operating cash, and reported year after year that it was meeting it. Between 2013 and 2016 it reported cash inflows from operations of £509 million against group operating profit of £501 million. Slightly over a hundred per cent. Treat the £472 million drawn through the facility as financing rather than as operating cash, as the ratings agencies argued it should be, and £37 million of that profit was cash-backed. A conversion rate of seven per cent.
Cash generated from operations is the number a dividend is supposed to be tested against.
It was tested once, on the record, and we know how that went.
In January 2017, Carillion’s finance director proposed withholding the final dividend in order to conserve cash and reduce debt. He was opposed by the chair of the audit committee and by the senior independent director. Neither of them argued that the cash was there. Both objected to the message that holding the dividend would send to the market, and one suggested it might be appropriate to say something about debt reduction at the right time. The minutes of the February board meeting record no further discussion of it. They record a recommendation of 18.45p.
That is the fault, and it is not an accounting fault.
Sixteen consecutive increases stop behaving like sixteen separate decisions. They become an institutional promise. The dividend begins as evidence that a company is strong and ends as a condition the rest of the company is required to protect. After that, evidence pointing the other way is no longer entering a neutral decision. It arrives as a threat to something the board has already committed to defending.
The same shape shows up elsewhere. The pension trustee asked Carillion to establish a formal link between the level of the dividend and the level of deficit recovery payments. The company refused. The performance measures used to set director bonuses did not include managing the risk in the pension deficit. Over the six years to 2016 the company paid £441 million in dividends against £246 million in deficit recovery payments, nearly twice as much to shareholders as to schemes it was already behind on. Between 2009 and 2016, House of Commons Library analysis puts total dividends at £554 million, around three quarters of the cash the operations generated across the same period. In 2016 itself, £78.9 million went out in dividends against £73.3 million of net cash from operating activities.
It showed up in one man’s diary too. Carillion’s chief executive later told MPs that something like sixty per cent of his time went on cash calls and on travelling to contracts to collect money, and that he flew to Qatar ten times a year for six years to chase payment on a single job. He said he felt like a bailiff. The head of the second largest construction company in the country was spending most of his working life retrieving cash the accounts had already recorded as revenue.
The arithmetic ran a long time before it broke. Then it broke quickly. The 10 July announcement ended the record. By the half-year results at the end of September the total charge had reached about £1.2 billion, wiping out the profits reported over the previous seven years and leaving net liabilities of £405 million. Borrowings had risen to £961 million. On 15 January 2018 Carillion entered compulsory liquidation with roughly £29 million in cash against liabilities of nearly £7 billion.
Build UK put the supply chain at around 30,000 companies. Between them they were owed something in the region of £2 billion, and most are estimated to have recovered less than a penny in the pound.
One of them was Vaughan Engineering, a mechanical and electrical contractor employing about 200 people, which had worked with Carillion for a decade. It was owed £830,000. It filed for administration on 28 March 2018, ten weeks after Carillion did, and told MPs the collapse was the principal factor in its own.
None of this needed inside information.
Three warnings were published before 1 March 2017, and each was available to anyone who went looking.
In March 2015, the UBS analyst Gregor Kuglitsch published research arguing that Carillion was more heavily leveraged than it reported. He pointed at the extended supplier payment terms and the reverse factoring by name, and said a profit shortfall was likely. That was two years before the peak, and it identified the mechanism rather than the symptom. Carillion’s own board minutes that April called the analysis disappointing.
On 22 September 2015, Markit Securities Finance reported that Carillion was the most short-sold stock in the STOXX 600, with short interest having doubled to 25.1 per cent of shares outstanding. By August 2016, IHS Markit had it carrying twice the short interest of any European company reporting that week, with 21 per cent of the shares out on loan. Short interest is not a diagnosis and it does not prove the sellers are right. At that level it is a question that wants an answer, and the data was free.
On 13 October 2016, Phil Oakley wrote a short piece for Interactive Investor headed “A stock in one chart: Carillion dividend risk”. He noted that the pension deficit was the largest in the FTSE 350 relative to market value, that the £47 million of extra cash put into the scheme in 2015 was money not going to shareholders, and that the dividend, which had cost £78 million in 2015, might have to be cut. He read the forecast yield of 7.7 per cent as the market already pricing that cut in. It ran on a free retail investing site, four and a half months before the results.
Two more warnings were sitting inside Carillion’s own published accounts, waiting for anyone willing to do the arithmetic. Borrowings had risen from £242 million at the end of 2009 to £689 million at the end of 2016, taking the ratio of debt to equity to 5.3, against a level of 2 widely treated as the outer edge of comfortable. The ratio of current assets to current liabilities had sat at around 1.0 from 2013 onwards, where anything below 1.2 is conventionally read as a company under strain.
For the investors, lenders and incoming chairs reading this, that is where the diligence question sits. The accounts carried formal assurance, and the quality of the challenge behind that assurance was later found wanting. The Financial Reporting Council concluded that KPMG’s 2016 work on Carillion’s financial position and going concern fell seriously short. The harder question sits behind the signature. Was anyone in that process required to read the payables line against the dividend line, and could their conclusion have survived contact with a sixteen-year record?
A different move was available, and it can be dated. Balfour Beatty faced many of the same pressures, including lowest-price tendering, weak UK construction demand and a legacy defined benefit pension, alongside its own sequence of profit warnings from 2013 to 2015. In January 2015 it cancelled a planned £200 million share buyback. At its 2014 results that March it decided not to recommend a final dividend in order to keep the cash, saying it expected to reinstate the payout by March 2016. It had already sold Parsons Brinckerhoff to WSP, with net proceeds of around £753 million, and it agreed a revised funding plan with its pension trustee. What that cost at the time was public and immediate. Balfour cut its payout to nothing for the year and told the market it was in trouble before the market had finished working it out.
This is a comparison rather than a controlled experiment. The two companies held different contracts, carried different exposures and were not run by the same people. The difference that matters is what each board did at the point where protecting the distribution came into conflict with protecting the cash. Carillion had the same options in 2014 and in 2015. In March 2026, Balfour Beatty reported average net cash of £1.2 billion and a record order book of £22.7 billion.
The principle does not depend on scale. A distribution is a claim on cash you have collected. Profit you have recognised is a different thing, and so is an order book. A business that pays out more than it collects is spending money it does not have and will need later, and the spending stays invisible for as long as the payables can be stretched to cover it.
The check takes an afternoon and requires neither a board process nor an auditor.
Take your last full year. On one side, the cash your operations actually generated. On the other, everything you took out as dividends or drawings, plus everything you are committed to paying into the long term, pension contributions first among them. If the second number is bigger, the difference came from somewhere, and the candidates are a short list: cash built up in earlier years, an asset sold, new borrowing, or working capital squeezed out of somebody else.
Then test where the operating cash came from. Did it improve because customers paid you sooner and finished work turned cleanly into money, or because the balance you owe your own suppliers went up? That second question is the one that catches the flattering version, and it is the one Carillion’s reported cash conversion of a hundred per cent would have failed.
If you want the fuller version, three further tests are worth running. Whether unbilled work, retentions and amounts recoverable on contracts are growing faster than revenue. Whether cash conversion has drifted outside the normal cycle for your sector. And whether the same shape appears in the most recent quarter as well as the full year, because the annual figure can be tidied at the year end in a way the quarter cannot.
If the gap between what your business reports and what it actually collects were widening now, an analysis like this would find it.
The harder question is what happens next.
Who in your business has the standing to say that the dividend, the drawing or the distribution is no longer evidence of strength? Who can stop it before another year is added to the record?
And have you made that person responsible for protecting the cash, or for protecting the story?